How Serverless is Accelerating GenAI Adoption
Do you want to receive an email notification whenever something goes wrong or any message is logged in your AWS Lambda function? With CloudWatch Logs and SNS, it’s easy to set up email alerts based on specific log message filters. This way, you’ll stay updated on your Lambda function’s performance and any issues that might arise.
Setting up Email Notifications for Lambda Errors using CloudWatch Logs & SNS
When your Node.js Lambda function produces logs, they are stored in CloudWatch Logs. You can then create metric filters in CloudWatch Logs to search for specific log messages based on filters such as INFO, ERROR, or WARN. Once you create the filter, you can attach a CloudWatch Alarm to it, which can be subscribed to an SNS topic. This way, you’ll receive an email notification each time the filter is triggered by a log message.
To add filters to your console statements in Node.js, simply include a filter keyword in your log statement. For example:
console.log('[INFO] This is an information message.')
console.log('[ERROR] This is an error message.')
console.log('[WARN] This is a warning message.')
This will make it easier to identify and filter specific log messages in CloudWatch Logs, and receive email notifications when they occur.
Pre-requisites for the process
Before you can set up email notifications for your Lambda function, you’ll need to have:
- A Lambda function with any runtime (we’ll be using Node.js in this example).
- An SNS topic with an email subscription that has been verified to receive emails.
Assuming you already have a Lambda function with filters added to your console statements, here’s an example code snippet:
exports.handler= async(event) => {
    try {
        const response = {
            statusCode: 400,
            body: JSON.stringify('Error from Lambda!'),
        };
        if(response.statusCode !== 200) throw new Error(response);
    } catch (error) {
        console.log('[ERROR] Error',error)
        return error
    }
};
Once you have a Lambda function and an SNS topic with an email subscription, you can create a CloudWatch Alarm to trigger email notifications based on log message filters.
Steps to Set Up Your Email Notifications for AWS Lambda Errors with CloudWatch Alarms
Here’s a breakdown of how you can create a CloudWatch alarm to trigger email notifications for Lambda errors.
Step 1: Creating a Metric Filter for Your Lambda Logs
- Go to the AWS Management Console and navigate to the CloudWatch.
- Choose “Logs” on the left navigation panel and select the log group for your Lambda function.
- In the log group, navigate to metric Filter section to select the “Create Metric Filter” button to create a new filter.
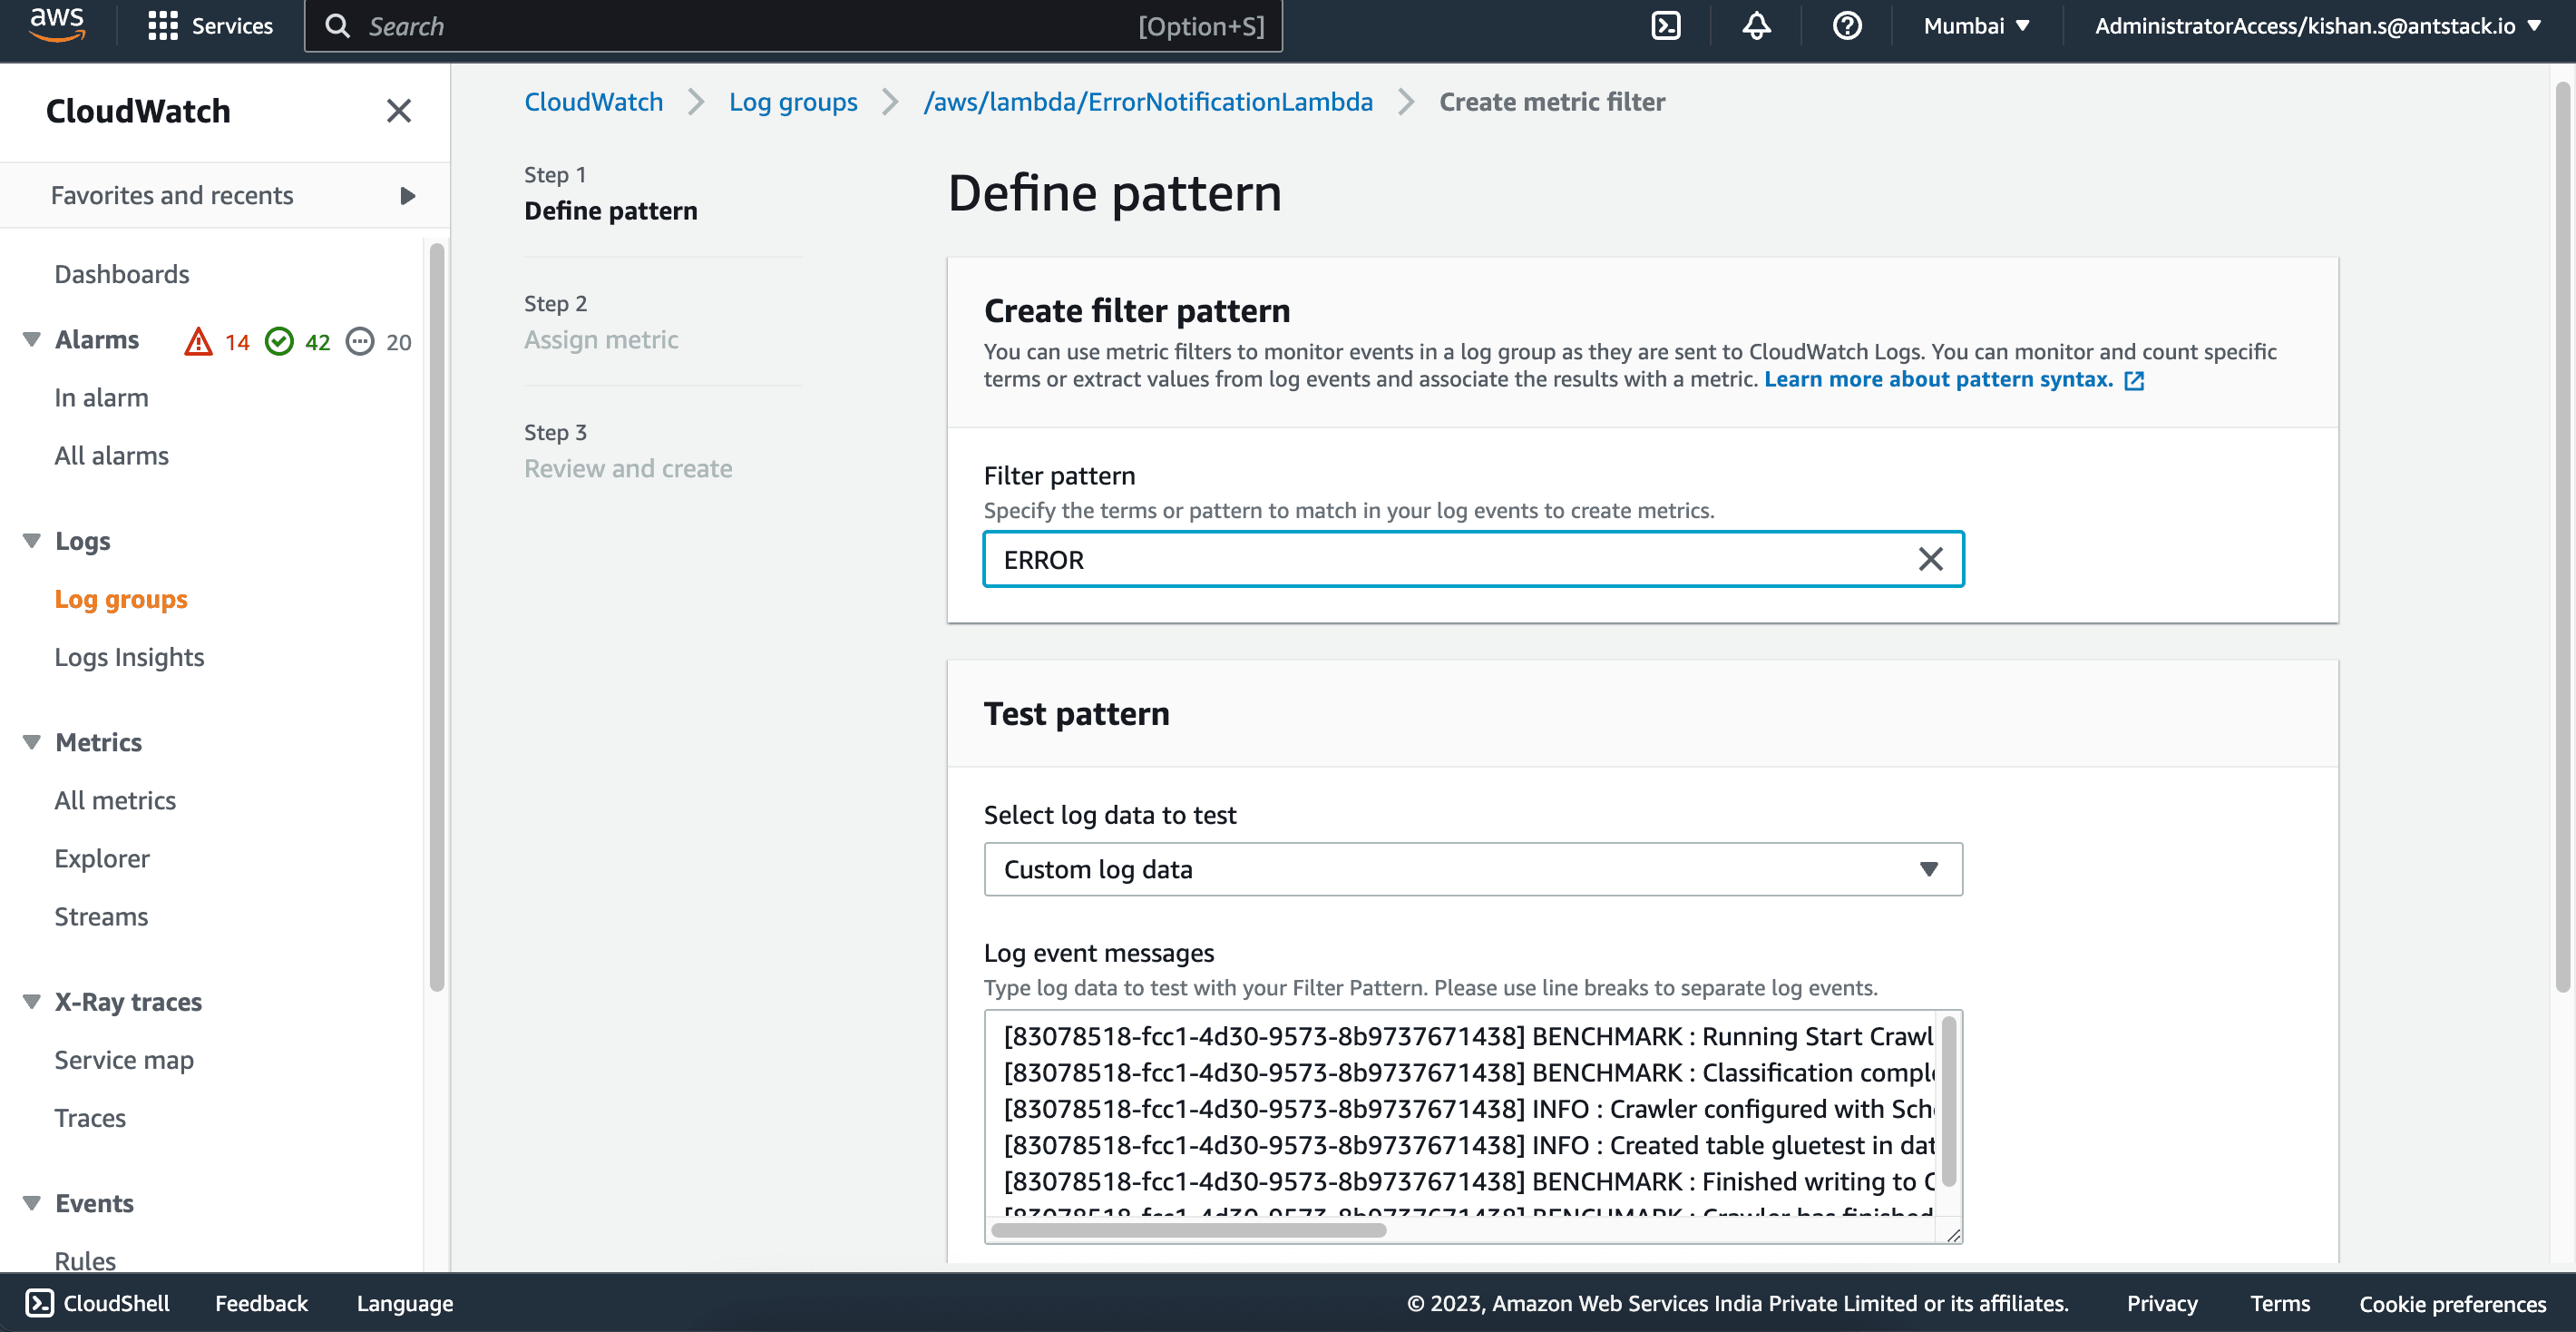
- In the “Define Logs Metric Filter” screen, enter a filter pattern. For example, if you want to create a filter for errors, you can use the pattern:
[ERROR]

 This will match any log entries that include the string “[**ERROR**]” in them.
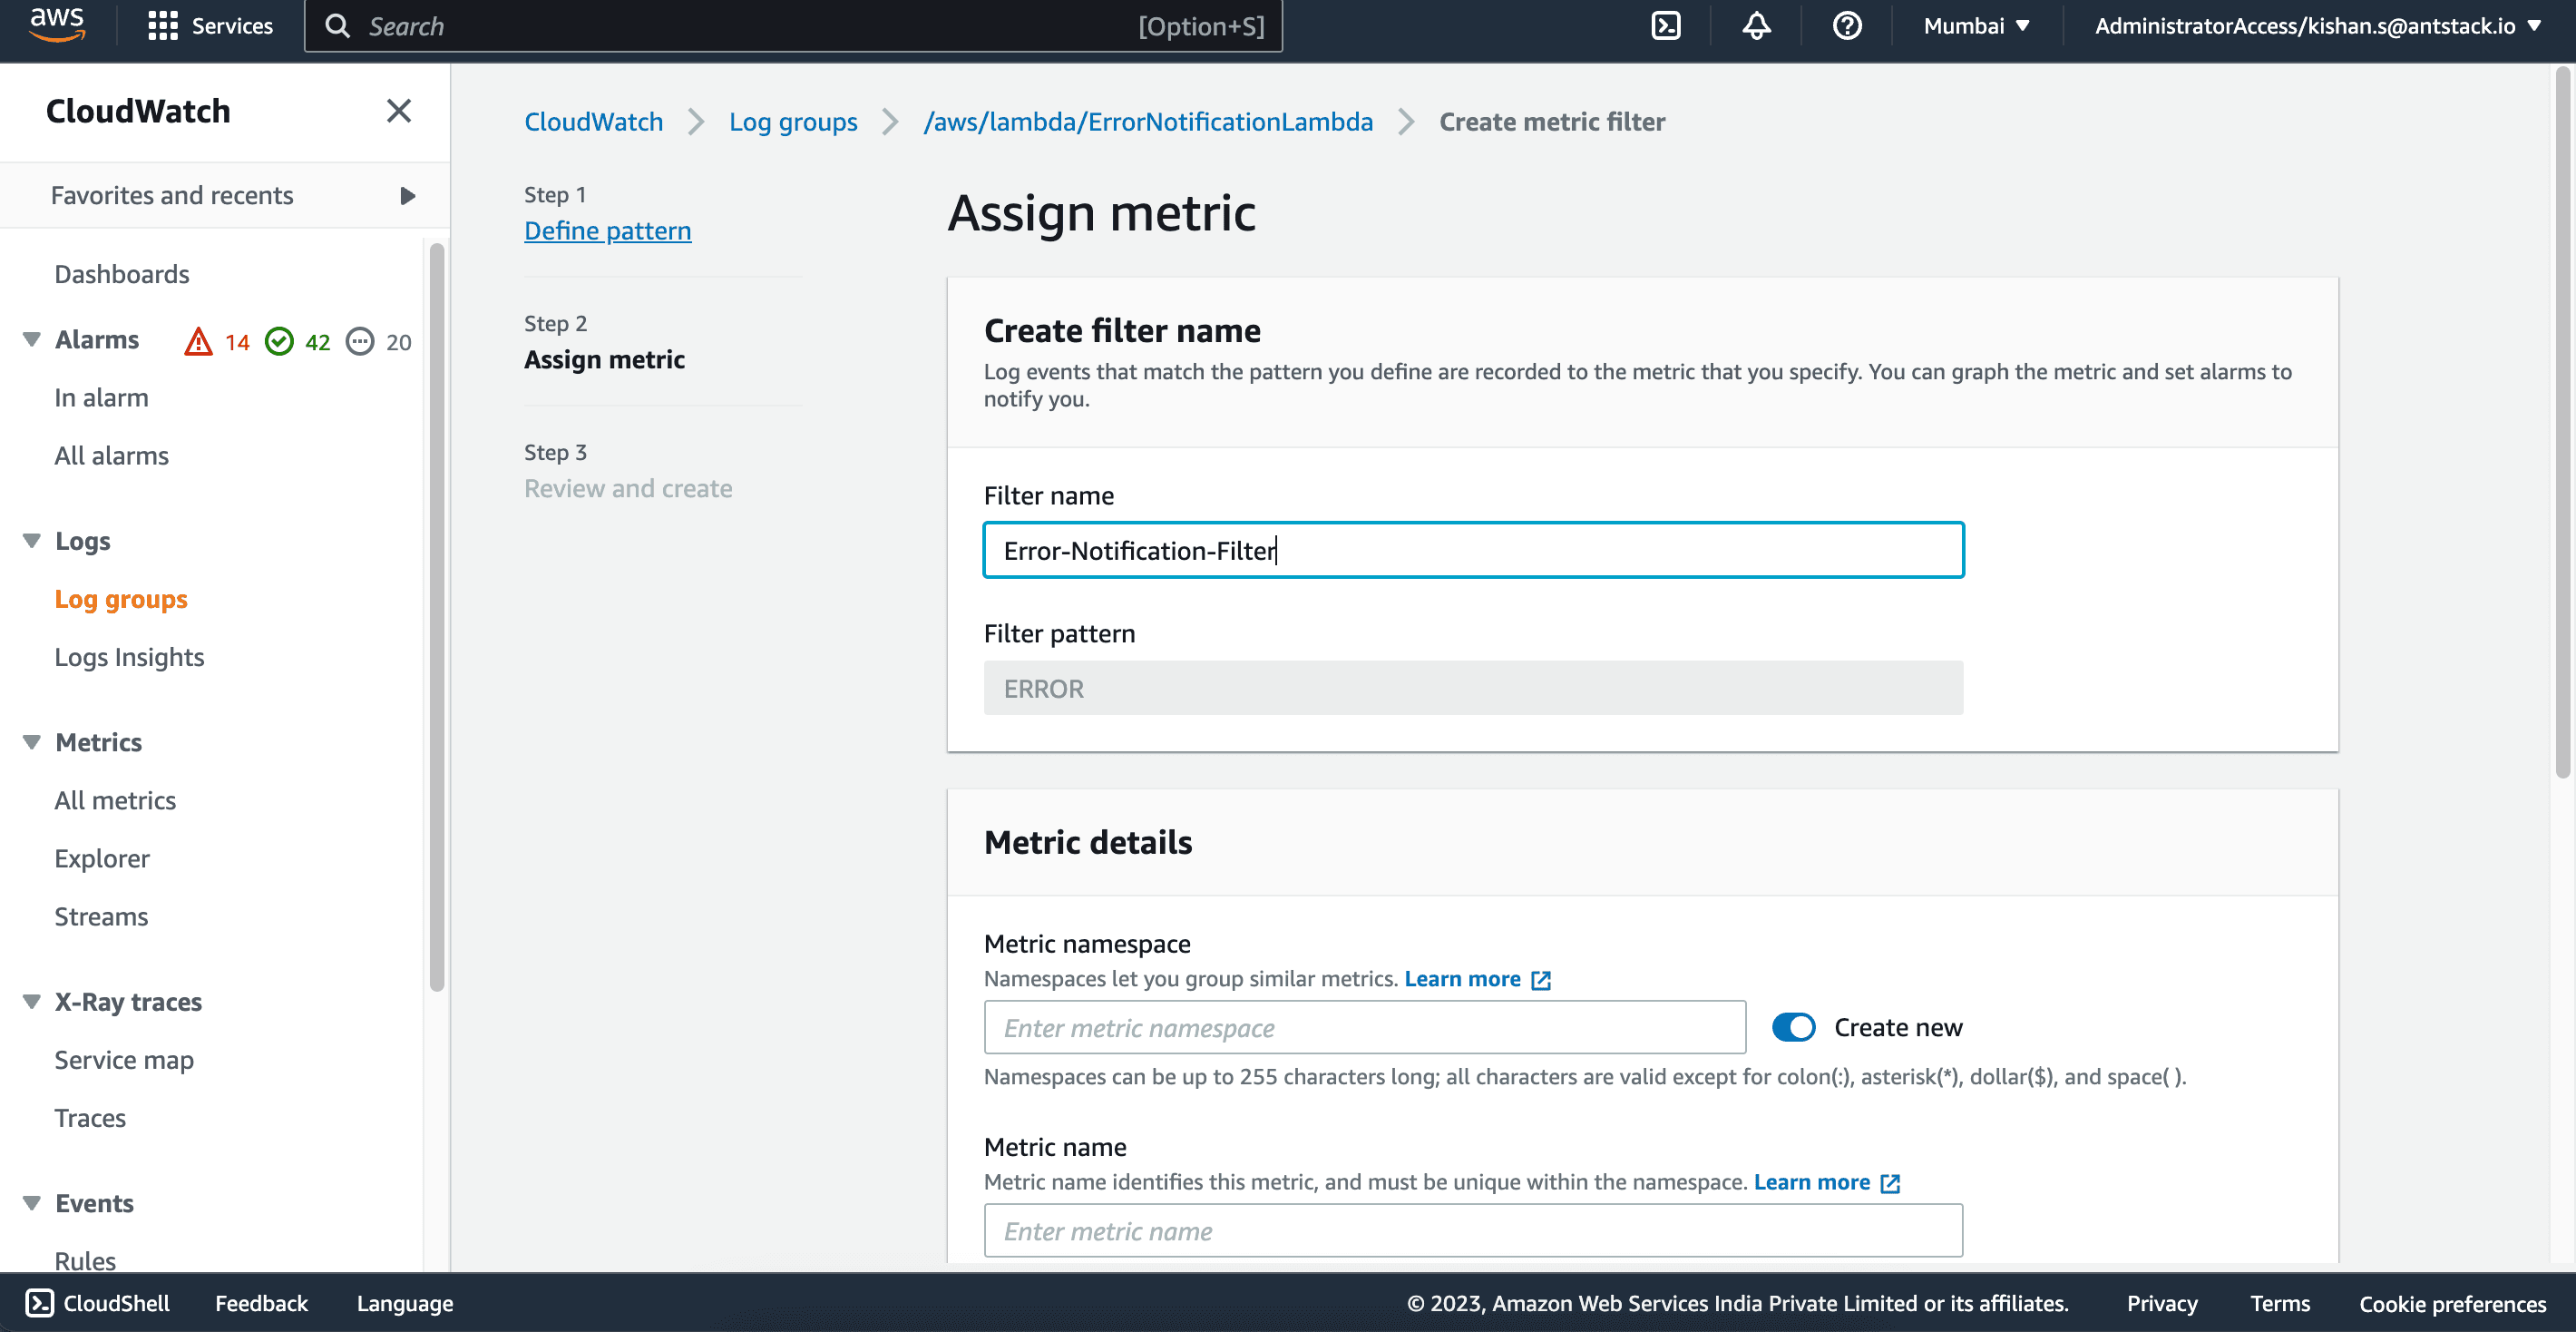
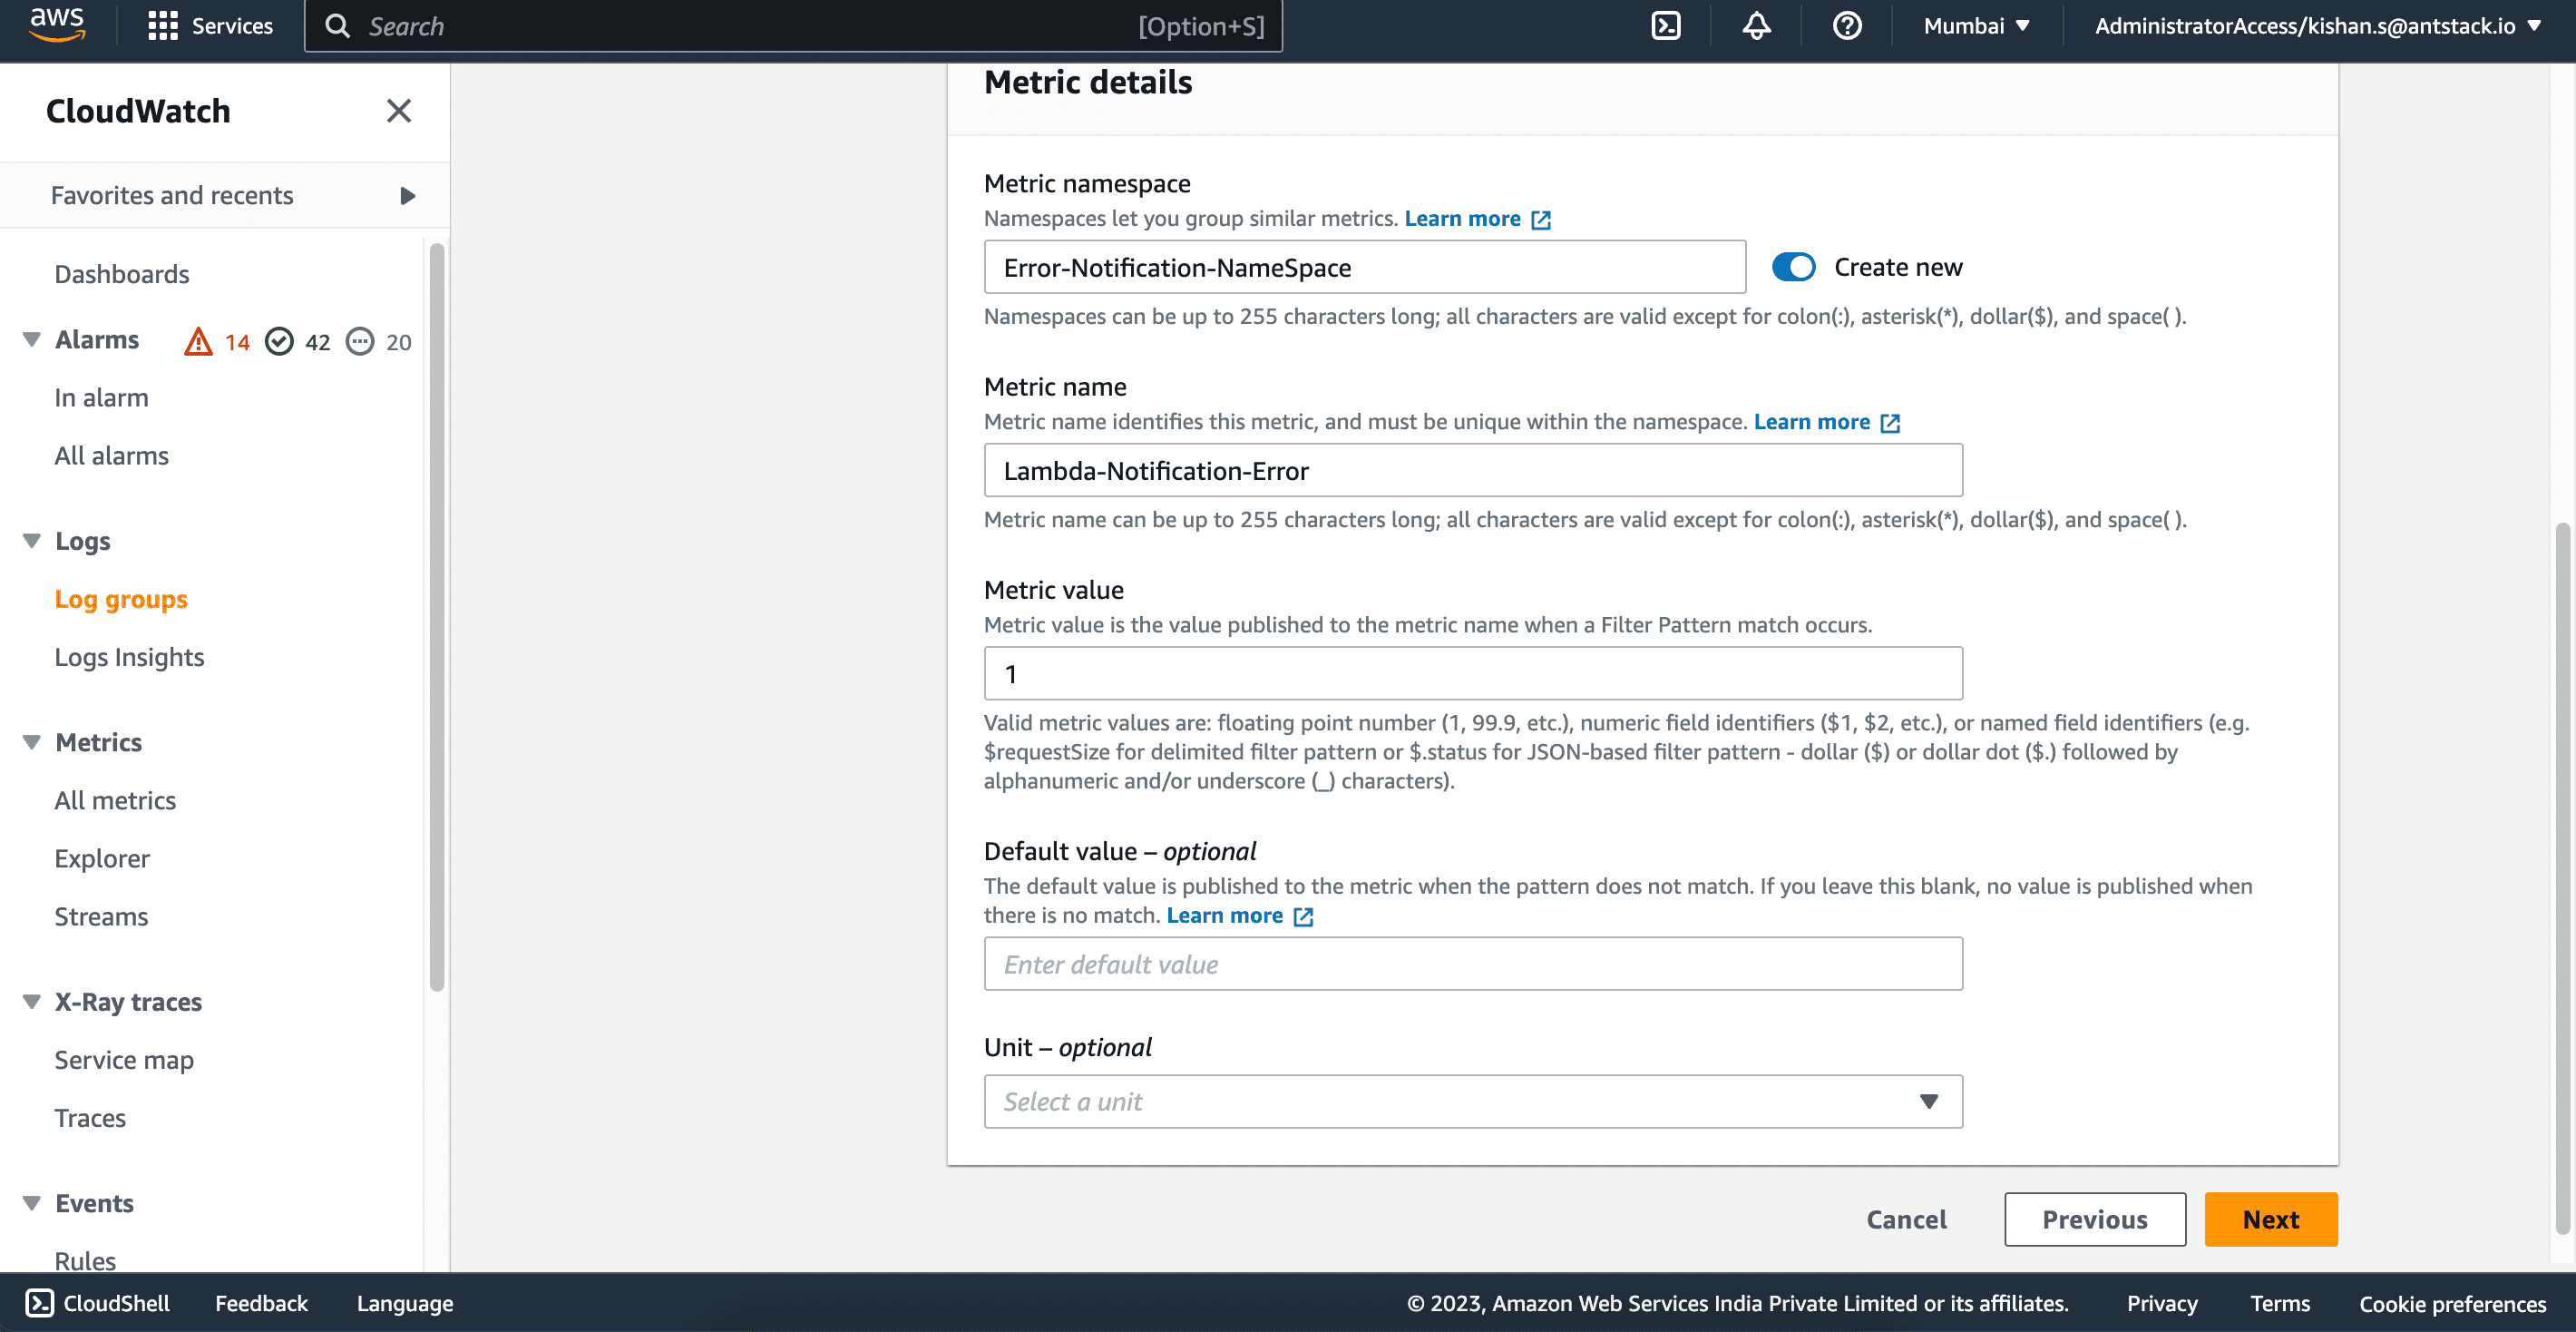
5. Next, define the details for your metric filter. Specify filter a name, and the metric details such as metric namespace, metric name, metric value, default value, and unit (optional).

6 .Click on button “Next” to review the filter settings once you’ve entered the details, click “Create Filter” to create the metric filter.
Step 2: Create a CloudWatch Alarm to Send Email Notifications.
The next step is to set up a CloudWatch alarm that will send email notifications based on this filter. Follow the below steps:
In the “Cloud watch log” screen, select the metric filter you created in the previous step as the source of your alarm and click on “Create Alarm”.
![Screenshot 2023-03-31 at 3.47.09 PM.png]()
Next, set up the conditions for your alarm. For example, if you want to be notified when there is at least one error in your Lambda logs during a 5-minute period, you can use the following settings:
- Metric: “Errors” (or whatever you named your metric filter)
- Statistic: “Sum”
- Period: “5 minutes”
- Conditions: “Greater than or equal to” threshold of “1”
![Screenshot 2023-03-31 at 3.48.53 PM.png]()
Input the conditions and threshold value(1 or more), later click on “Next” button to configure the actions for your alarm.
![Screenshot 2023-03-31 at 3.49.17 PM.png]()
Enter the details for your SNS topic In the “Actions” screen. This should include the name of the SNS topic and the email address you want to send notifications to.
![Screenshot 2023-03-31 at 3.51.53 PM.png]()
Add Name to your cloudwatch alarm and review the settings and click on “Create Alarm” to create the alarm.
![Screenshot 2023-03-31 at 3.52.19 PM.png]()
Now that it is configured, your CloudWatch alarm will send email notifications to the chosen email address whenever the criteria you specified are satisfied.
Step 3: Now,It’s time to test it out
Everything is done lets trigger the lambda from api gateway,Once the Lambda function is triggered and produces an error, the CloudWatch alarm will be triggered as well.
Check the status of the CloudWatch alarm, navigate to the “Alarms” section in the CloudWatch service console. You should see the alarm you created in the list of alarms. If there was an error produced by the Lambda function, the alarm will be in an “In alarm” state.
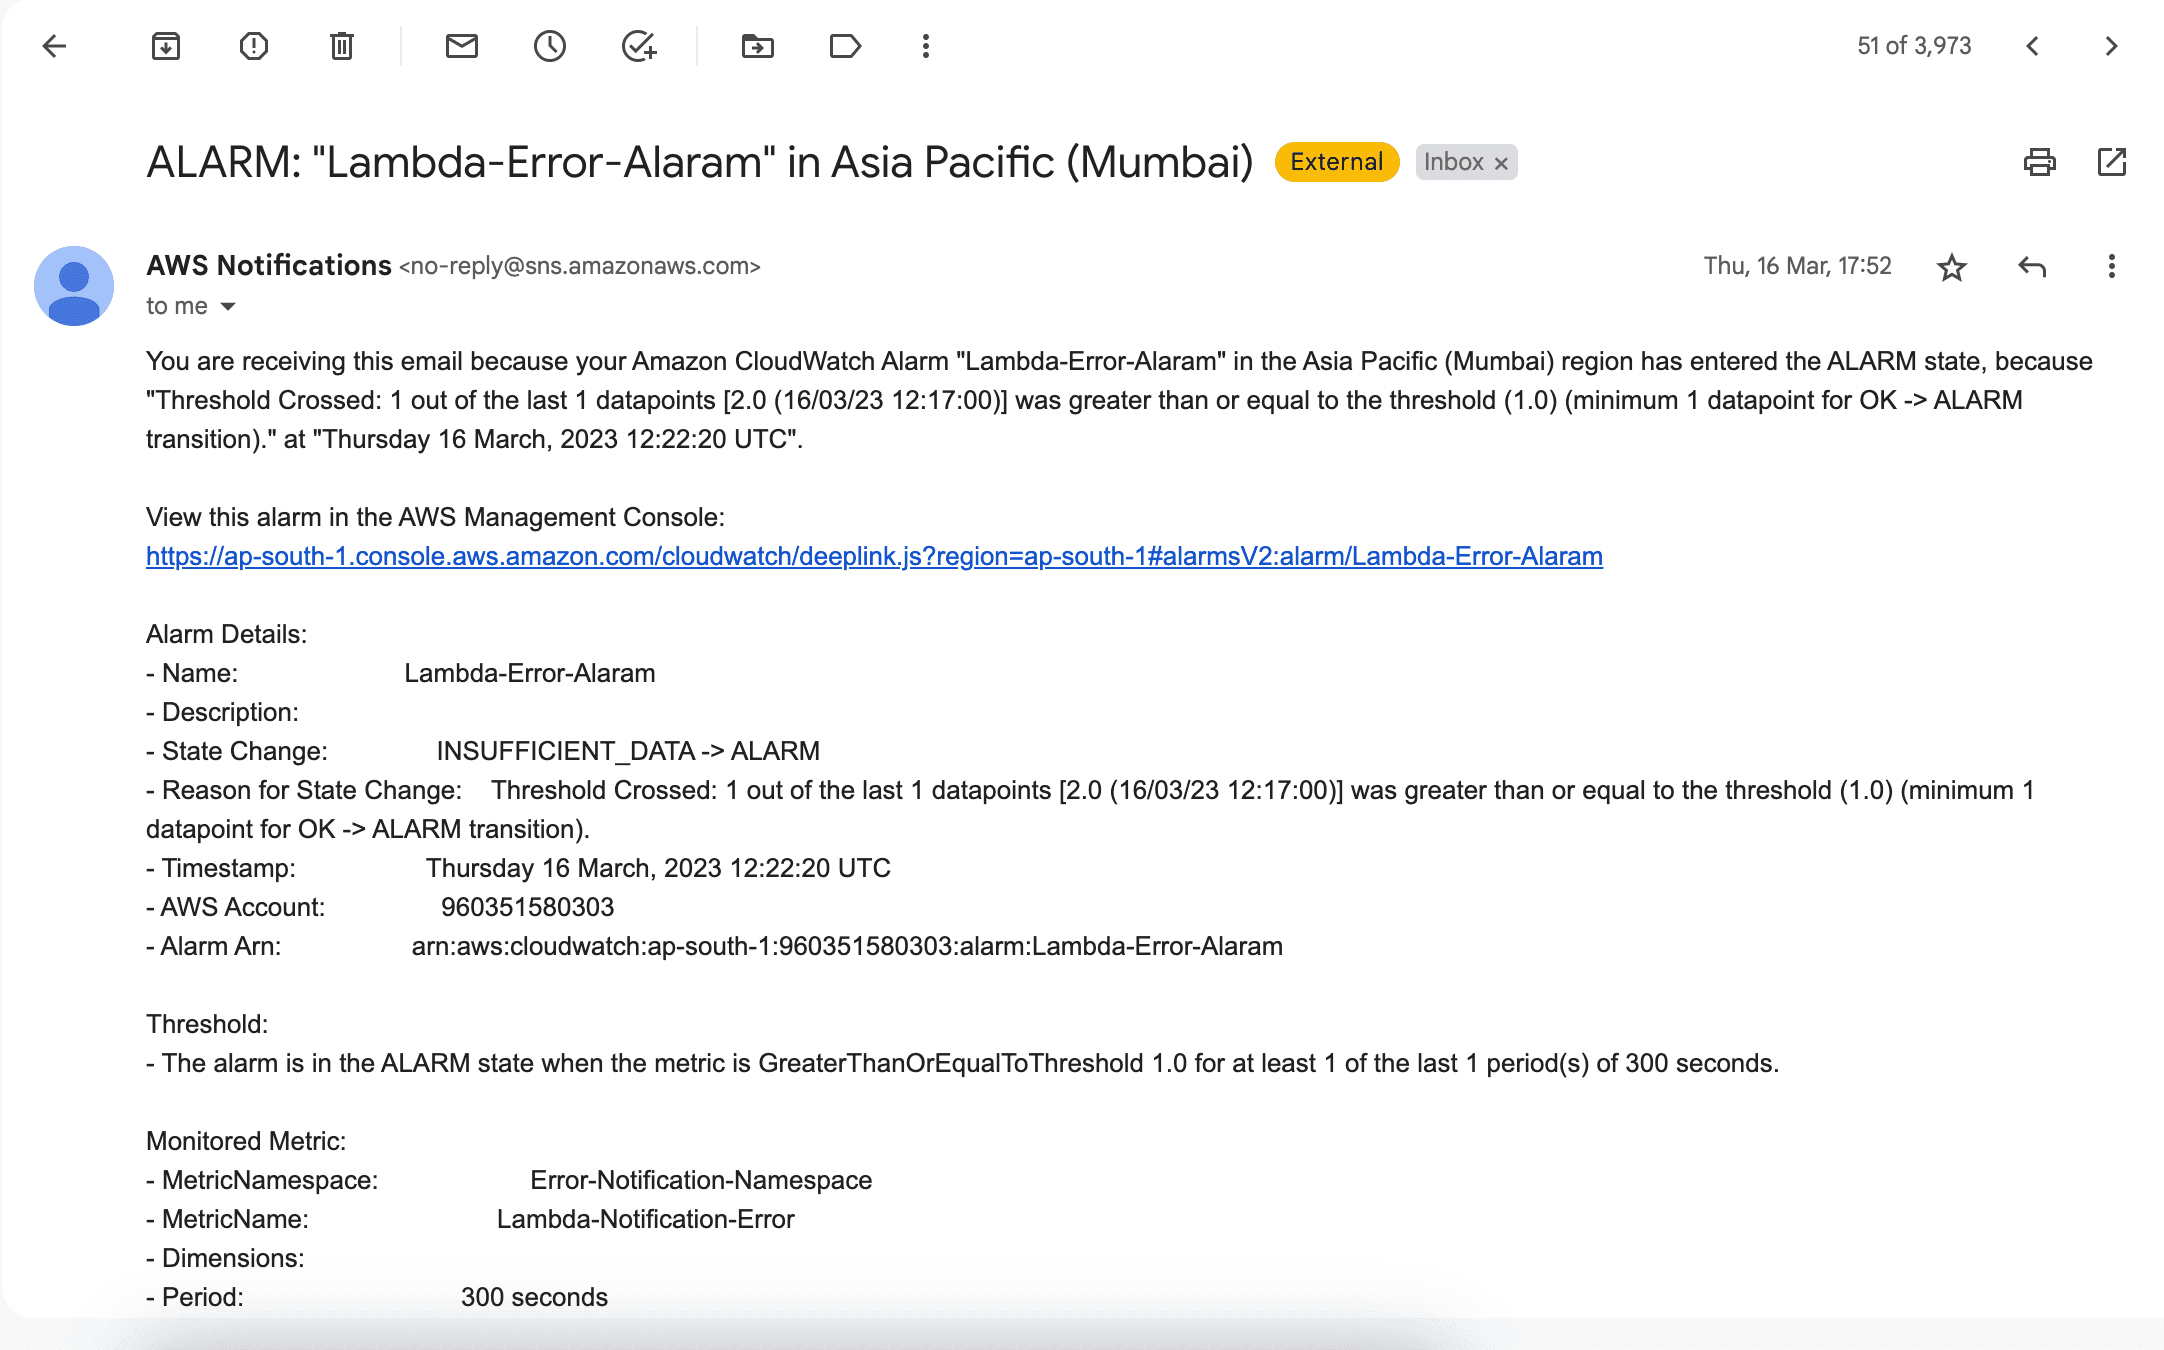
Finally, check your email inbox to make sure you received the email notification. The email will contain the details of the error that triggered the alarm, along with other relevant information like the time of the error.

Congratulations! You have successfully set up email notifications for your Lambda function using CloudWatch alarms and SNS topics. This will help you stay on top of any errors that occur in your Lambda function and take corrective action as quickly as possible.
Benefits of Implementing Lambda Error Alarm
Receiving instant notification for AWS Lambda errors helps maintain application reliability. Here are some operational & business benefits of email alerts
- In a microservices architecture, where multiple services interact, an error in one can affect other services, leading to downtime or degraded service quality. Instant notifications allow developers to respond quickly and minimize the potential impact on users, ensuring the system remains functional.
- Developers can streamline their workflow and prioritize debugging, improving the overall development process.
- It can also prevent escalation and costly outages.
- With detailed error emails, teams can identify recurring issues and make informed decisions regarding architectural improvements.
Conclusion
By implementing a proactive monitoring system, that is, email notifications for lambda errors, you can enhance your application’s reliability and your team’s efficiency in handling issues. In this article, I have outlined in detail how you can set up email notifications for AWS Lambda errors using CloudWatch alarms.


